- Home
- AI Design Generator
- Venngage
Venngage
Open Website-
Tool Introduction:Build infographics, reports, and slides fast with AI templates.
-
Inclusion Date:Oct 21, 2025
-
Social Media & Email:
Tool Information
What is Venngage AI
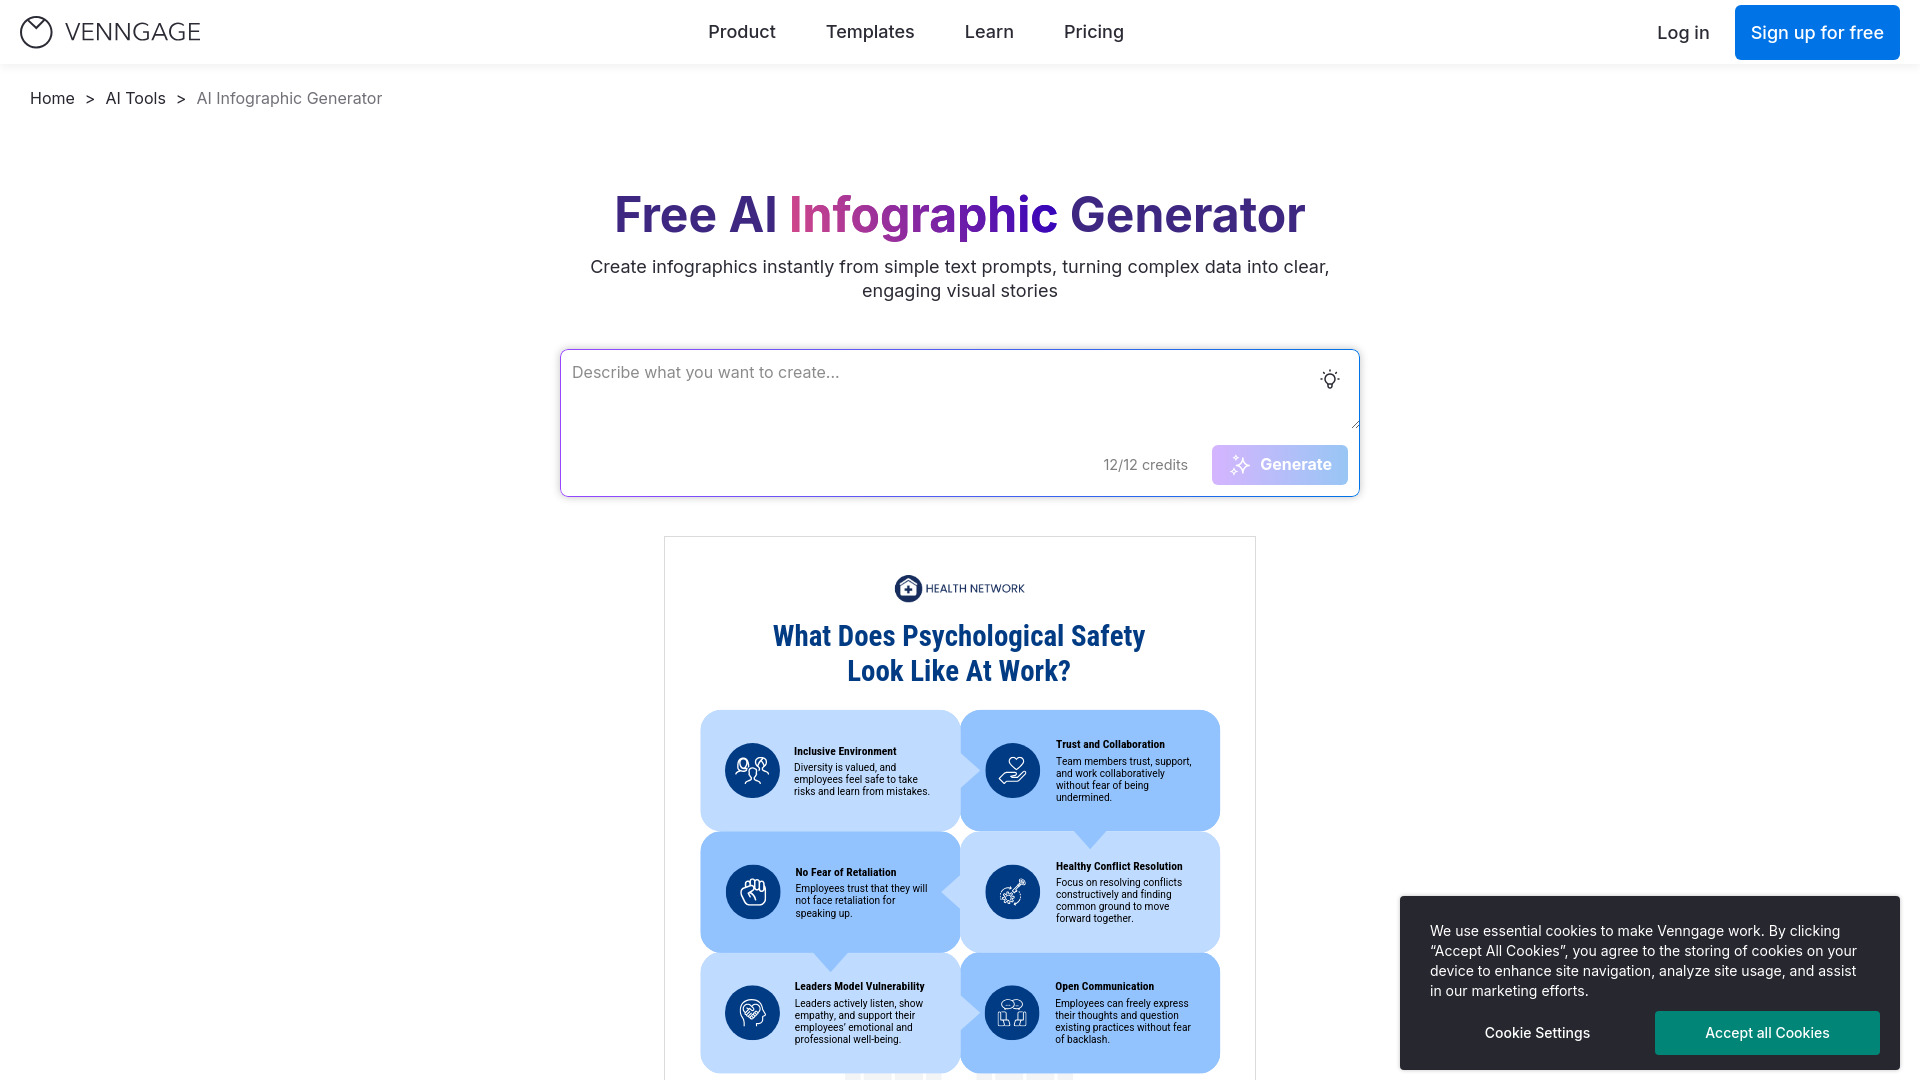
Venngage AI is an online infographic and design platform for creating impactful presentations, infographics, reports, and more. It combines a friendly drag-and-drop editor with a wide library of customizable templates, making professional design accessible to marketers, educators, and business teams. With AI-assisted recommendations for layout, content structure, and data visualization, it helps turn ideas and datasets into clear, on-brand visuals that are easy to share, present, and publish—without advanced design skills.
Venngage AI Main Features
- Template library: A broad selection of professionally designed templates for infographics, presentations, reports, posters, and dashboards.
- Drag-and-drop editor: Intuitive editing to add text, icons, images, and charts, plus fine-tune spacing, alignment, and hierarchy.
- AI-assisted suggestions: Smart guidance for layout choices, content blocks, and visual structure to speed up design decisions.
- Data visualization: Create charts and visual summaries by adding your data, helping communicate insights clearly.
- Brand consistency: Apply your brand colors, fonts, and styles for consistent, on-brand visuals across assets.
- Collaboration and feedback: Work with teammates and stakeholders to review, comment, and iterate efficiently.
- Sharing and export: Share links or download designs in common formats suitable for presentations, print, or the web.
Who Should Use Venngage AI
Venngage AI suits marketers, educators, small businesses, startups, nonprofits, and corporate teams that need to present information visually. It works well for campaign reports, lesson materials, executive summaries, internal communications, investor decks, and data-driven updates where clarity, speed, and brand consistency matter.
How to Use Venngage AI
- Sign up or log in to your Venngage account.
- Choose a template that matches your goal (infographic, presentation, report, poster, or dashboard).
- Use the drag-and-drop editor to add text, images, icons, and charts.
- Leverage AI-assisted suggestions to refine layout, structure, and visual hierarchy.
- Import or paste your data and select appropriate chart types for clear visualization.
- Apply brand colors and fonts to maintain a consistent look and feel.
- Collaborate with stakeholders for feedback, then share or export your finished design.
Venngage AI Industry Use Cases
Marketing teams summarize campaign performance with data-rich infographics and one-page reports. Educators create lesson visuals and syllabus overviews for clearer instruction. Nonprofits compile impact reports and fundraising slides. Startups craft investor-ready pitch decks and product roadmaps. HR and operations teams produce onboarding guides and policy summaries that are easy to understand at a glance.
Venngage AI Pricing
Venngage typically offers a mix of free and paid plans. Free access covers core editing and selected templates, while paid subscriptions unlock premium templates, advanced branding controls, collaboration options, and enhanced export choices. Availability of trials or promotional access may vary.
Venngage AI Pros and Cons
Pros:
- Large, customizable template library for fast creation.
- AI-assisted layout and structure suggestions that reduce design guesswork.
- Clear data visualization to communicate insights effectively.
- Branding tools that keep visuals consistent across assets.
- Collaborative workflow for reviews and iterations.
- Accessible, browser-based editor with a gentle learning curve.
Cons:
- Highly specialized or complex designs may require more manual adjustments.
- Free plan limitations on templates, assets, or export quality can impact advanced needs.
- AI suggestions assist design decisions but do not replace strategic messaging or data analysis.
Venngage AI FAQs
-
Does Venngage AI require design experience?
No. The drag-and-drop editor, templates, and AI-assisted suggestions help non-designers create professional visuals quickly.
-
Can I visualize my own data?
Yes. You can add your data to charts and visual elements to present metrics, trends, and comparisons clearly.
-
How does branding work?
You can apply brand colors, fonts, and styles to keep presentations, infographics, and reports consistent.
-
What export options are available?
You can share designs via links or download them in common formats suitable for web, print, and presentations.
-
Is collaboration supported?
Yes. Teams can review, comment, and iterate within the platform to finalize designs efficiently.