- Home
- AI Charting
- Graphy
Graphy
Open Website-
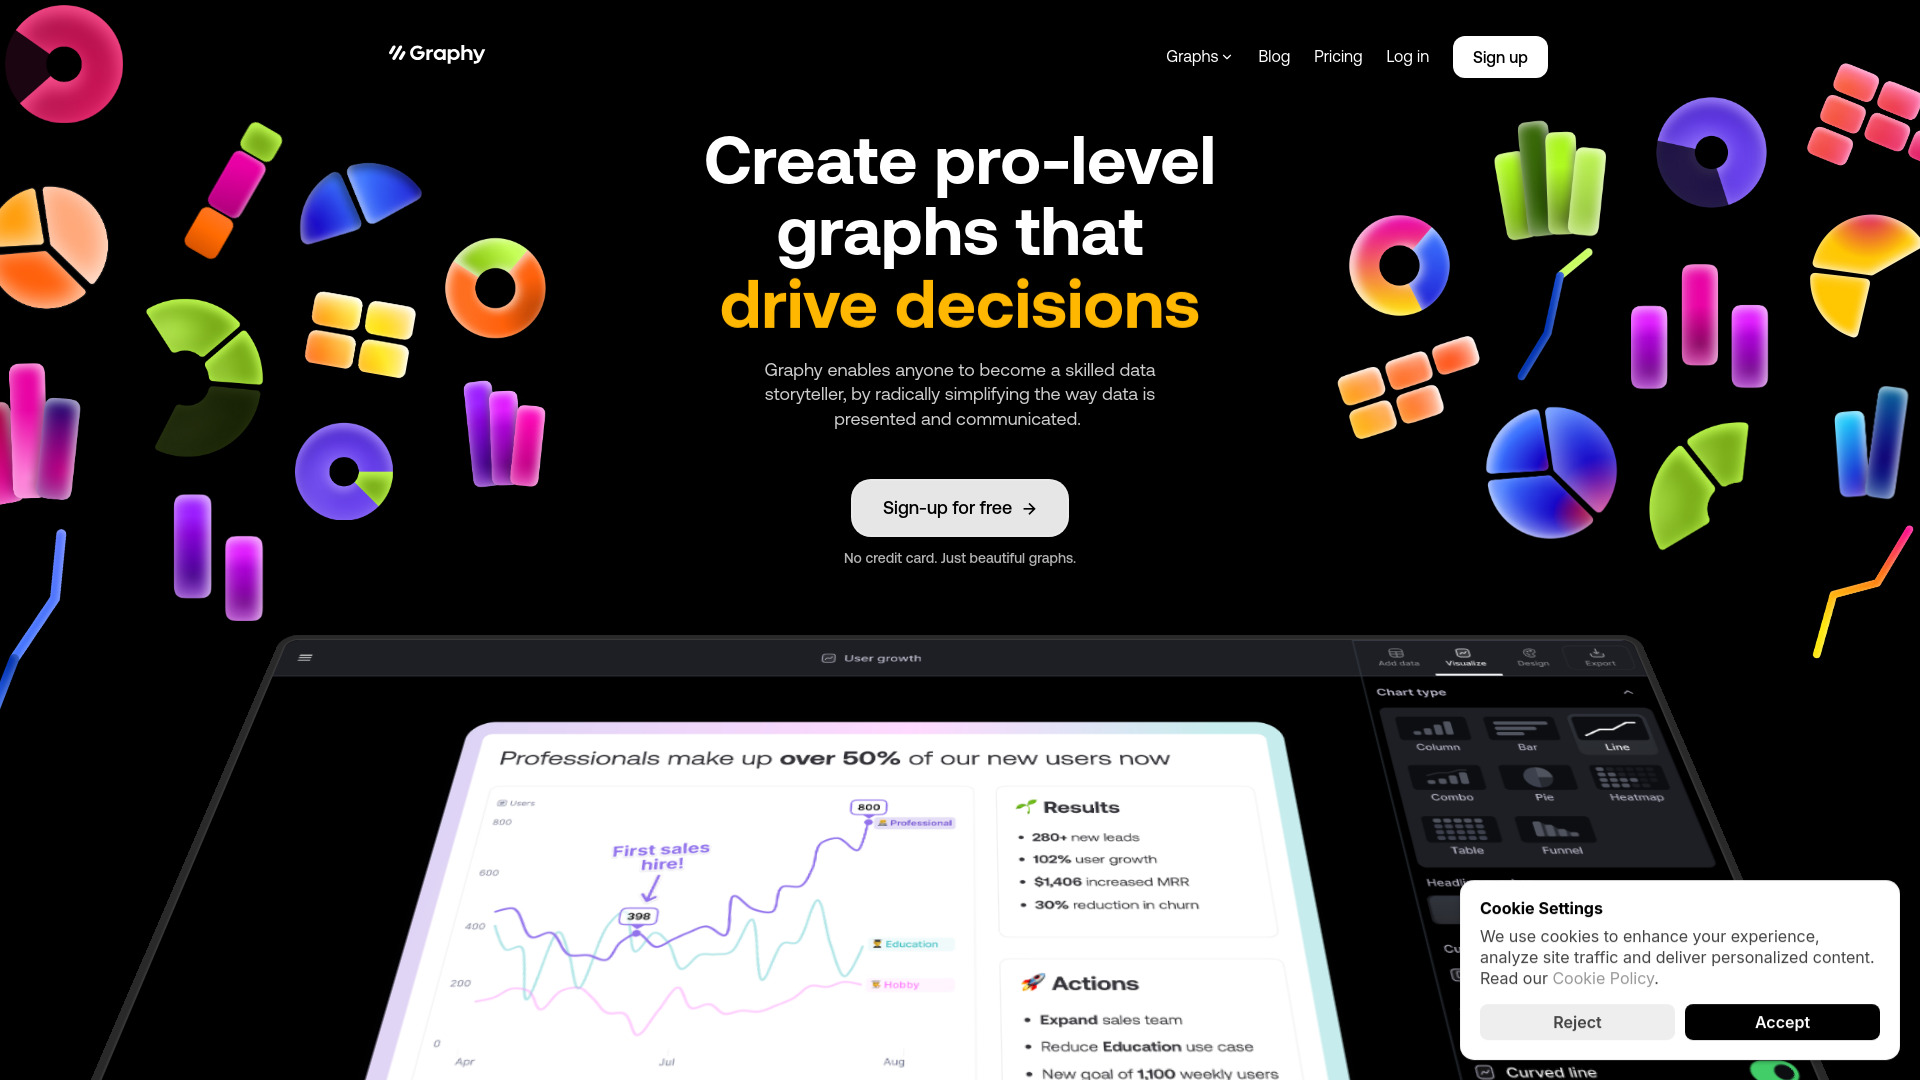
Tool Introduction:Tell data stories with AI charts. Google Sheets in, decisions out.
-
Inclusion Date:Oct 28, 2025
-
Social Media & Email:


Tool Information
What is Graphy AI
Graphy AI is an AI-powered data storytelling platform that simplifies how insights are crafted, visualized, and communicated. It helps teams turn raw metrics into clear narratives with pro-level graphs that inspire action, drive decisions, and align stakeholders. Trusted by 100,000+ users, Graphy combines AI-generated insights with fast, intuitive visualization, suggesting effective chart types and summaries in seconds. With seamless connections to Google Sheets and other data sources, it enables modern teams to build persuasive, audience-ready visuals without complex tooling or steep learning curves.
Graphy AI Key Features
- AI-generated insights: Automatically surfaces trends, outliers, and summaries to contextualize your data and guide decision-making.
- Pro-level graphs in seconds: Generates effective chart types and layouts, reducing manual formatting and speeding up reporting.
- Google Sheets integration: Connects directly to Google Sheets and other data sources to keep visuals aligned with live data.
- Story-first design: Add annotations, titles, and callouts that turn charts into compelling data stories for stakeholders.
- Team-friendly workflows: Built for modern teams to keep everyone aligned with consistent visuals and shared narratives.
- Lightning-fast visualization: Responsive performance enables rapid iteration during meetings and reviews.
- Clean, accessible aesthetics: Clear, presentation-ready visuals that are easy to read and understand for non-technical audiences.
Who Should Use Graphy AI
Graphy AI is ideal for product managers, marketers, analysts, sales leaders, founders, and operations teams who need to present data with clarity and impact. It suits anyone responsible for weekly KPIs, board updates, campaign reporting, roadmap reviews, or stakeholder communications. Educators and consultants can also use it to translate complex datasets into accessible stories that persuade and inform.
How to Use Graphy AI
- Sign up and create a new project to organize your visuals and narratives.
- Connect a data source, such as Google Sheets, and select the relevant worksheet or table.
- Choose the metrics or dimensions you want to highlight and let the AI suggest charts and insights.
- Refine the visuals by adjusting chart types, labels, colors, and scales to match your audience.
- Add annotations, headlines, and takeaways to frame the story behind the numbers.
- Share with your team or present directly to stakeholders to support decisions and alignment.
Graphy AI Industry Use Cases
A marketing team summarizes campaign performance by combining AI-suggested charts and narrative takeaways for weekly exec updates. A product team presents feature adoption and churn trends with annotations that clarify hypotheses and next steps. Sales operations align regional leaders around pipeline changes using clear visuals that spotlight risks and opportunities. A startup founder compiles investor-ready charts that highlight traction, retention, and growth drivers.
Graphy AI Pros and Cons
Pros:
- Transforms raw data into clear, persuasive stories with minimal setup.
- AI-generated insights reduce analysis time and surface what matters.
- Direct connection to Google Sheets keeps visuals current.
- Fast, intuitive interface supports live iteration during reviews.
- Accessible visuals that resonate with non-technical audiences.
Cons:
- May not replace deep statistical analysis or complex modeling needs.
- Quality of insights depends on the structure and accuracy of your source data.
- Highly specialized customization might require manual adjustments.
Graphy AI FAQs
-
How does the AI improve data storytelling?
It suggests effective chart types, highlights key trends or anomalies, and proposes concise summaries so you can focus on decisions rather than formatting.
-
Does Graphy AI work with Google Sheets?
Yes. It connects to Google Sheets and other data sources, helping keep charts aligned with your latest data.
-
Is it suitable for non-analysts?
Yes. The interface and AI guidance make it easy for non-technical users to create professional, presentation-ready visuals.
-
Can teams use it for stakeholder alignment?
Absolutely. Graphy AI is built for modern teams to communicate insights clearly and keep everyone on the same page.